Data engineering
Stop arguing about whose numbers are right
Sound familiar?
The problems we are usually called in to fix
- Problem 01
Three reports, three answers
Finance, operations and sales each pull their own numbers, and meetings start with reconciling them.
- Problem 02
Spreadsheet-driven decisions
Critical figures live in files emailed between people, with no history, no checks and no single owner.
- Problem 03
Data you cannot trust
Duplicates, gaps and silent errors mean nobody is quite sure the dashboard is right.
- Problem 04
AI ambitions without foundations
Predictive projects stall because the underlying data is not collected, joined or stored consistently.
What we deliver
What we build and run for you
Pipelines, data models and dashboards that give leadership the same accurate numbers, refreshed automatically and ready for decisions.
Data pipelines
Automated extraction from core systems, files and APIs into a clean, well-modelled store.
KPI dashboards
Focused executive and operational dashboards with drill-down, built around the questions you actually ask.
Data quality & monitoring
Validation rules, freshness checks and alerts that tell you when something breaks, before a report goes out wrong.
Event tracking & telemetry
Capture what happens in your apps and processes so you can measure adoption, drop-off and performance.
Governance foundations
Clear ownership, access controls and documentation for every important dataset.
Analytics for AI readiness
Feature-ready datasets that make forecasting and machine learning projects faster and cheaper to start.
How it works
A clear path from idea to production
Working software every two weeks, demonstrated to you, with security and documentation built in from the first sprint.
- 01
Metric definition
We agree what each KPI means, where it comes from and who owns it, before building anything.
- 02
Source mapping
Every system, file and feed is catalogued, profiled and assessed for quality.
- 03
Pipeline build
Automated, tested pipelines move and transform data on a schedule you can rely on.
- 04
Dashboards & adoption
We design dashboards with the people who will use them and train teams to self-serve.
- 05
Monitor & evolve
Quality checks run continuously and the model grows as new questions and sources appear.
Use cases by industry
Where Data & BI pays off
Related work
Proof, not promises
 Banking
Inventory management system
A high-performance asset-tracking system with a dual-backend architecture and strong data integrity.
- Python
- Flask
- FastAPI
 Agriculture
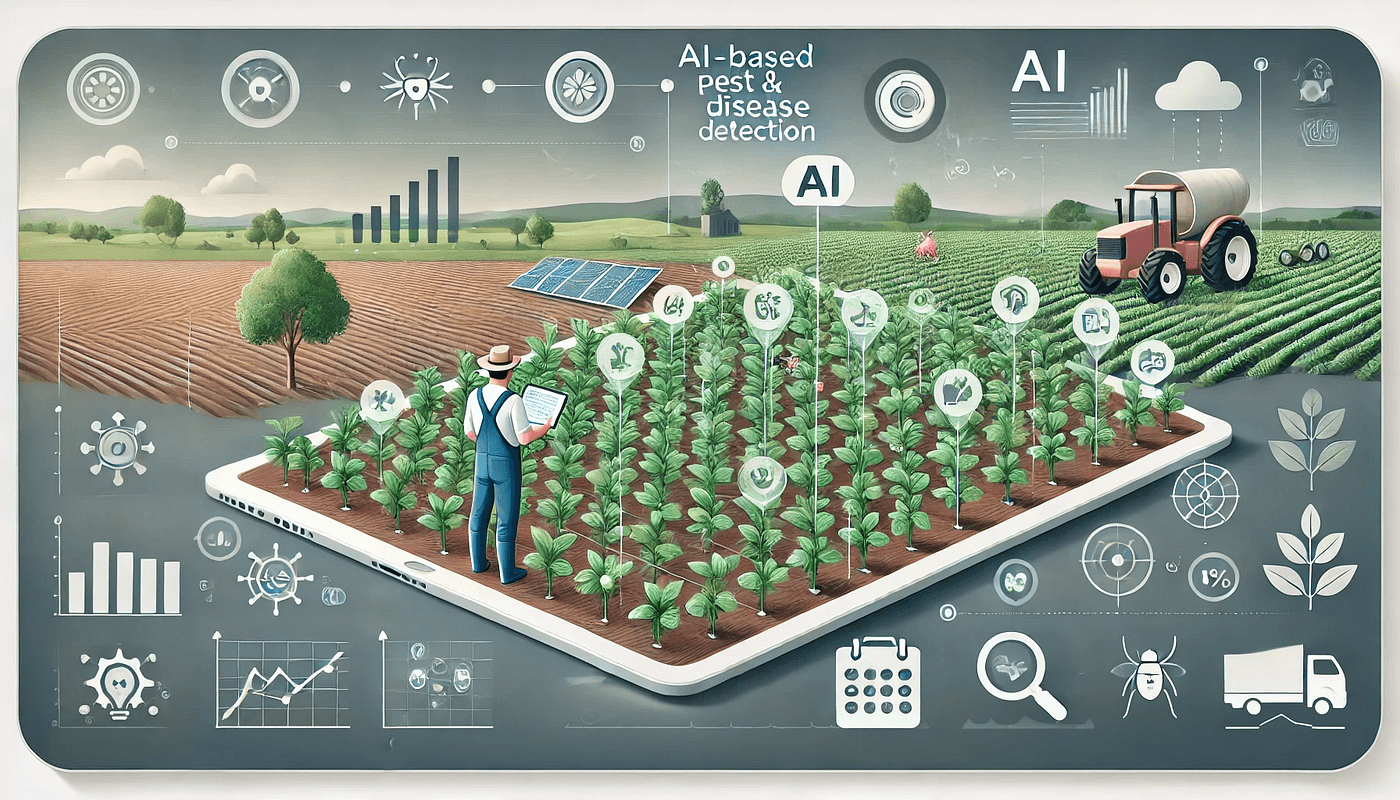
Zeus AI AgroApp
An AI farming assistant: image-based pest and disease detection, soil analysis, market forecasting, activity tracking and farmer education.
- Python
- Next.js
- FastAPI
 Healthcare
Hospital help-desk system
Streamlines hospital operations with internal ticketing, staff task assignment and real-time response tracking.
- PHP
- MySQL
- JavaScript
Tools and technologies behind our Data & BI work
- Python
- Pandas
- NumPy
- SQL
- MySQL
- MariaDB
- IBM DB2
- SQLite
- FastAPI
- Next.js dashboards
- Statsmodels
- Prophet
FAQ
Data & BI questions, answered
Do we need a data warehouse?
Not always. For many organisations, a well-designed relational database with automated pipelines is enough. We recommend the simplest architecture that meets your volume, speed and budget.
Can you work with our existing reporting tools?
Yes. We can feed your current tools with clean data, or build focused web dashboards where existing tools fall short.
How often can the data refresh?
From daily batches to near real-time, depending on your sources and needs. We design the refresh rate around the decisions the data supports.
Who owns the data and the code?
You do. Pipelines, models and dashboards are documented and handed over, and your data stays in infrastructure you control.
Free assessment
Have a process that’s slow, manual or risky? Let’s engineer a smarter one.
An engineer, not a salesperson, will reply within one business day. The first assessment is free and there is no obligation.